Energy market overview: Increased renewable energy production led to an electricity price nearly a third lower than in last year
Compared to December, Estonia’s average electricity price increased by 9.1% in January, reaching €92.0 per megawatt-hour (9.2 cents per kilowatt-hour). Compared to January last year, when the electricity price was €126.48 per megawatt-hour, this year’s price was 27.2% lower – a decrease of more than €30. The main price drivers were a decrease in wind energy production compared to the previous month, the Estlink 2 electricity connection interruption, and higher consumption due to cold weather and increased heating demand.
In January, we consumed an exceptionally high amount of wind energy and a record-low amount of oil shale energy for winter
A total of 785.7 GWh of electricity was consumed in Estonia in January, of which 456.6 GWh was produced domestically. With the start of production at the Sopi-Tootsi wind farm, wind energy covered 22.6% of Estonia’s consumption (13.5% in January 2024), while oil shale accounted for 22.5% (34.7% in January 2024). Similar to last year, 41.9% of electricity demand was covered by imports. The share of other production sources remained rather minimal alongside imports, oil shale and wind energy.
The timing of peak prices and favourable hours has not changed compared to last year
Last year, the most ‘expensive’ hours in January, compared to the monthly average price, occurred in the mornings between 07:00–09:00 and in the afternoon between 15:00–18:00. During these previously mentioned hours, the morning hourly prices were approximately 28% higher than the monthly average, while the afternoon hours were about 44% higher. The most favourable hours were between 23:00–04:00, with prices averaging 44% lower than the monthly average.
January 2025 did not differ significantly from the historical averages mentioned, as the most expensive and most favourable hours occurred in exactly the same time periods, with morning hours (07:00–09:00) being 37.0% higher than the monthly average and evening peak hours (15:00–18:00) nearly 44.1% higher. The electricity price remained most favourable in January as well, between 23:00–04:00, during which prices were 54.9% lower than the monthly average (see chart).
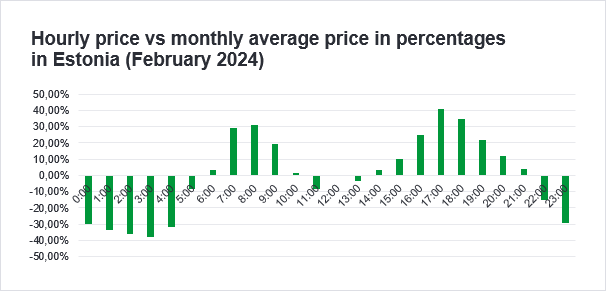
How to manage your consumption in February?
February is expected to show a similar price trend to January. Historical averages indicate that higher-priced hours can once again be expected in two time periods: in the morning between 07:00–09:00 and in the afternoon between 16:00–18:00. In February 2024, electricity prices during the morning hours were on average 26.4% higher than the monthly average price, while evening hours were up to 33.6% higher.
Lower-priced hours can once again be expected between 23:00–04:00. In 2024, prices during this period remained 33.3% lower than the monthly average. For example, if the average electricity price in February were €100 per megawatt-hour, the price during the previously mentioned evening hours would be on average €133.6 per megawatt-hour, or €33.6 higher. Historical trends do not guarantee the future but provide a clear indication for smart consumption.
The electricity price remained steady across the Baltics, the price was brought down by the increase in renewable energy production
Electricity prices in the Baltics remained at a relatively similar level to those in Estonia in January. The average electricity price in January 2024 reached €91.9 per megawatt-hour, which is €0.1 lower than in Estonia. In Lithuania, the average electricity price was €89.4 per megawatt-hour, which was €2.6 lower than in Estonia. The price differences were mainly caused by various electricity connection maintenance works.
A surge in wind energy was also noticeable across the Baltics – in January, more wind energy was produced in the region than in any previous year. In January, 178.2 gigawatt-hours of wind energy were produced in Estonia, which is 46.1% more than a year earlier. In Lithuania, as much as 429.6 gigawatt-hours of wind energy were produced, which is 14.5% more than in 2024. Latvia’s wind energy production was more modest, remaining at 29.7 gigawatt-hours, which is 14.7% less than a year earlier. However, the limited wind energy was offset by very high hydropower generation, which covered as much as 52.6% of Latvia’s total consumption in January.
Cold weather drove up gas prices and the cost of carbon allowances in Europe
At the beginning of January, the gas price remained at €46.1 per megawatt-hour, and warmer weather in Europe was expected to reduce heating demand. However, by the end of January, the price had risen to €50.4 per megawatt-hour. The price increase was mainly influenced by colder weather and weaker wind energy generation in Europe, which increased the demand for gas plants. Heating demand increased both in households and in industries, which further fuelled the price growth.
Although gas supplies remained stable, the levels in gas storage facilities decreased faster than usual. In mid-January, the gas storage capacity in Northwestern Europe was forecasted to be at 63%, but due to a rapid temperature drop, the gas volume had already fallen to 46% by the end of January. The rapid decrease in volumes is not yet considered a significant risk indicator, but it raises concerns among traders about how Europe will replenish its stocks during the summer.
At the beginning of the month, the price of European carbon allowances was €73.8 per tonne. Milder weather kept the demand for carbon allowances relatively low. Throughout January, prices increased, and by the end of the month, the price had reached €81.8 per tonne. The main driver of the price increase was higher electricity prices in Germany, which led industries to purchase more carbon allowances, thereby pushing the price up. In addition, the price was also influenced by the cancelled carbon allowance auction in Poland, which led to a decrease in the supply of carbon allowances. At the same time, colder weather in Central Europe drove up prices: colder temperatures resulted in more carbon-intensive production, which increased the demand for carbon allowances.
Given that carbon allowances did not move in line with electricity and gas prices, it is reasonable to assume that carbon trading also contributed to the price increase throughout January. Throughout January, investment funds increased their holdings to 53 million allowances, the largest since 2021. The beginning of February will show whether the speculative price increase will be sustained or if a correction will occur based on reality, such as policy and industrial production.
Karl Joosep Randveer, Energy Trading Analyst at Eesti Energia
The market overview has been compiled by Eesti Energia according to the best current knowledge. The information provided is based on public information. The market overview is presented as informative material and not as a promise, proposal or official forecast by Eesti Energia. Due to rapid changes in the regulation of the electricity market, the market overview or the information contained in it is not final and may not correspond to future situations. Eesti Energia is not liable for any costs or damages that may arise in connection with the use of the information provided.
Would you like to stay informed about the energy market?
Join our monthly energy market overview newsletter on LinkedIn !